Fitting of Principal Components or Independent Components using TRENDanalysis
Parameters
- The
fittingis used to fit principal components (PC) or independent components (IC) calculatd by Trendmain or TREND NMR. To these PCs and ICs, TRENDanalysis fits an equation selected in thefittingmodemenu. This can include an equation that you provide yourself. TRENDanalysis will save an html report to directory containing the input data.
The report will have the suffix of_fitting_result.html
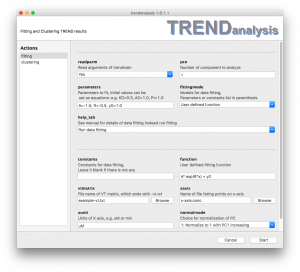
- When the
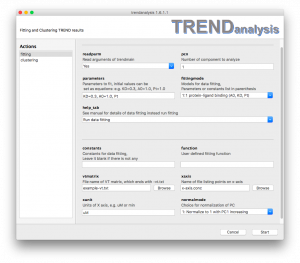
readparmoption is turned on by choosingYes,TRENDanalysisfits a PC or IC calculated byTrendmainorTREND NMR. The component is recorded by X and Y coordinates and any units provided for the X-axis. Ifreadparmis turned off by choosingNo, the PC or IC will be read instead fromvtmatrix,xaxis, andxunit. pcnspecifies which PC or IC to fit. It must be a positive integer. By default it is set to 1.parametersspecifies the parameters to fit. The parameters are separated by commas (,). Parameters and their values to initialize fitting can be given as equations, e.g.
e.g.KD=0.3. When a parameter is given without an inital value, such asPt, the initial value will be set as 1.
Note all parameters must exist in the fitting function specified underfittingmodeorfunction.fittingmodeallows the user to choose to fit a standard equation of TRENDanalysis. See Fitting models for details.help_tab
By defaulthelp_tabis set toRun data fittingwhich directs TRENDanalysis to fit a curve. Choosing an option other thanRun data fittingwill print out definitions of parameters listed under thefittingmodeonce theStartbutton is pressed. This will launch a help file in html format.constantspecifies which values to fix in the fitting function. It can be left blank. Setting constants is similar to settingparameters.functionallows user to define their own custom functions. See User defined function for details. Note that equation starts withy=is not allowed.vtmatrix
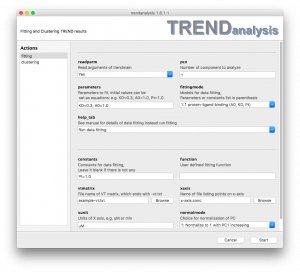
Whenreadparmis turned off,vtmatrixis used to as the source of PCA results calculated by TRENDmain or TREND NMR.xaxis
Whenreadparmis turned off,xaxisis used to read the X-axis filexunit
Whenreadparmis turned off,xunitsets the unit of X-axisnormalmodesets the normalization mode of PC or IC to be fit. See Trendplot manual for details of normalization mode.
Fitting models:
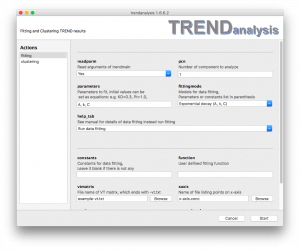
- 1:1 protein-ligand binding (y_end, KD, Pt)
These three (y_end, KD, Pt) each can be either a parameter to fit (set in parameters) or fixed to a constant value (see the constant field). This model provides an equation for 1:1 protein-ligand binding: ![]() where y is the fraction of bound or free protein (indicated by PC or IC), x stands for total ligand concentration [Lt] which is listed in the file specified in the
where y is the fraction of bound or free protein (indicated by PC or IC), x stands for total ligand concentration [Lt] which is listed in the file specified in the xaxis field in Trendmain, TREND NMR or TRENDanalysis, refers to the dissociation constant to fit. You should list an initial guess for the value of in the parameters field. Pt represents the total protein concentration, y_end represents the amplitude of the y-axis of the binding isotherm at infinite ligand concentration. When the binding isotherm is represented by a normalized PC1, the initial value of can be set to 1.0. Note, the unit of Pt must be identical to units of the values of X set in the xunit field. The binding affinity has the same units.
An example of 1:1 protein-ligand binding is shown below.
- Exponential decay (A, K, C)
The function of Exponential is ![]() , where A is the amplitude of the difference between the initial value and the estimate of the asymptote that function approaches . is the offset of this asymptote from zero, k is the fitted rate constant of the decay. Rate can be calculated as inverse of t: R= 1/t.
, where A is the amplitude of the difference between the initial value and the estimate of the asymptote that function approaches . is the offset of this asymptote from zero, k is the fitted rate constant of the decay. Rate can be calculated as inverse of t: R= 1/t.
Similar to 1:1 Protein Ligand Binding, must be defined in either pararmeters or constants. However, TRENDanalysis can initialize parameters for exponential fitting (both exponential growth and decay) automatically and hence their initial values do not need to be set, such as:
- Exponential recovery (A, C, T)
The function is ![]() , where is the amplitutde of the difference between the initial value and the estimate of the asymptote that the function approaches is the offset of this asymptote from zero, T is the fitted time constant of the recovery. T = 1/k, where k is from the exponential decay function, equivalent to this function. These parameters must be defined in either the list of
, where is the amplitutde of the difference between the initial value and the estimate of the asymptote that the function approaches is the offset of this asymptote from zero, T is the fitted time constant of the recovery. T = 1/k, where k is from the exponential decay function, equivalent to this function. These parameters must be defined in either the list of parameters or constants.

- Two-exponential decay(A1, t1, A2, t2, C)
The function of Two exponential decay is ![]() , where stand for amplitudes of the two phases, are time constants of two phases, and is the offset between zero and the asymptote approached at high values of x. The user must choose the initial values carefully according to the shape of the component and points to be fitted.
, where stand for amplitudes of the two phases, are time constants of two phases, and is the offset between zero and the asymptote approached at high values of x. The user must choose the initial values carefully according to the shape of the component and points to be fitted.
- Langmuir equation (KD, Imax)
This model determines by fitting the binding isotherm with the equation, y=(Imax * x) / (KD+x), where y the changes during titration, refers to the maximum intensity change, x refers to the total ligand concentration ligand concentration [Lt], just as it does for the 1:1 protein-ligand binding model above. A recent example applied the Langmuir equation to a titration measured accurately by WaterLOGSY at low [protein] (Huang et al., 2017, Sci. Rep.).
- Henderson-Hasselbalch equation (pKa, ymax, ymin)
This model determines pKa by fitting the equation 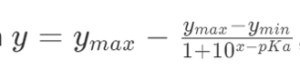 , where y is the change of chemical shift or PC during the titration and x, x is the pH of the sample.
- Linear regression
Since linear regression does not need parameters or constants, these two options are ignored when linear regression is chosen.
- User defined function
Besides the models descrbied above, TRENDanalysis also supports user-defined functions. The equation can be input in function text field, while its parameters and constants are set in the same way as descrbied above. Note that initial values are very important for any non-linear curve fitting. In the fittingmode field, select user-defined function, and enter the equation in the function field as illustrated in this example:
Note that y= is not used when entering in the function to be fitted. It is important that the number of data points in the component to be fitted exceed the number of fittable parameters by one, at the very least.